Image Details
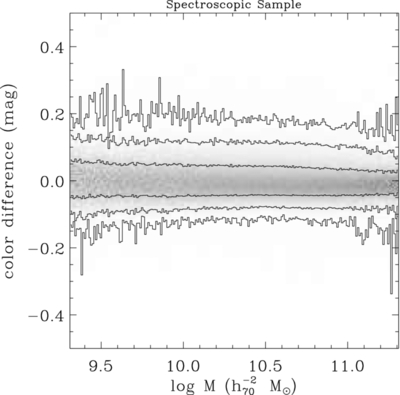
Caption: Figure 8.
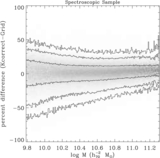
Difference between the K-correct-estimated [ 0.1 g − 0.1 r] color and the [ 0.1 g − 0.1 r] color estimated by the Grid Method. The gray scale and the contours are similar to those in Figure 7.
Other Images in This Article
Show More
Copyright and Terms & Conditions
© 2012. The American Astronomical Society. All rights reserved.
Copyright ©
2025 Astronomy Image Explorer. All Rights Reserved.