Image Details
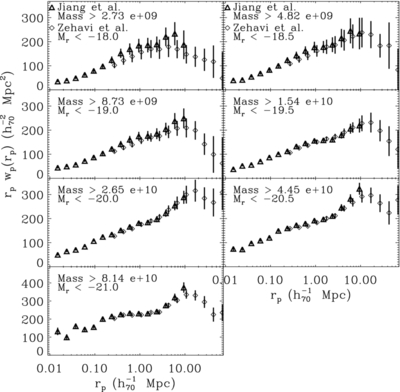
Caption: Figure 20.
Projected correlation function w p( r p) for the spectroscopic subsamples corresponding to mass-threshold samples as labeled, calculated as described in the text on small scales, combined with projected correlation function on intermediate scales from Zehavi et al. (2011). Please note that in order to compare these results easily, we offset the points of Zehavi et al. (2011) by 12% of our interval to the right.
Other Images in This Article
Show More
Copyright and Terms & Conditions
© 2012. The American Astronomical Society. All rights reserved.
Copyright ©
2025 Astronomy Image Explorer. All Rights Reserved.