Image Details
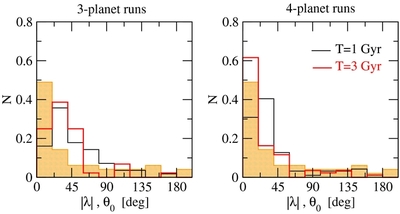
Caption: Figure 16.
Distribution of θ 0, that we obtained in our simulation for T = 1 Gyr (black histogram) and T = 3 Gyr (red), compared with the measured distribution of the misalignment angle, |λ| (yellow).
Other Images in This Article


Show More
Copyright and Terms & Conditions
© 2012. The American Astronomical Society. All rights reserved.
Copyright ©
2025 Astronomy Image Explorer. All Rights Reserved.