Image Details
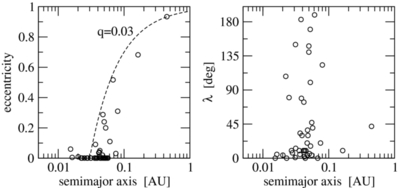
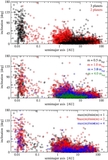
Caption: Figure 4.
Distribution of known exoplanets with measured λ. Left plot shows eccentricity as a function of the semimajor axis. The dashed line denotes constant pericentric distance q = 0.03 AU. Right plot shows λ as a function of the semimajor axis.
Other Images in This Article


Show More
Copyright and Terms & Conditions
© 2012. The American Astronomical Society. All rights reserved.
Copyright ©
2025 Astronomy Image Explorer. All Rights Reserved.