Image Details
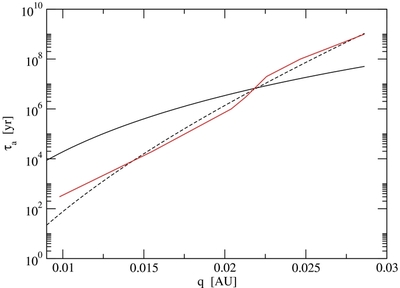
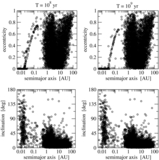
Caption: Figure 3.
Orbital decay timescale as a function of the pericentric distance q for a Jovian-mass planet in an initial quasi-parabolic orbit. Black curve is the prediction of the equilibrium tide model ( Q′ p = 5 × 10 6), while the red curve is the numerical estimate from the dynamical model from Ivanov & Papaloizou (2011). The dashed curve was obtained from the equilibrium tide model by modifying the tidal parameters according to Equation (5).
Other Images in This Article


Show More
Copyright and Terms & Conditions
© 2012. The American Astronomical Society. All rights reserved.
Copyright ©
2025 Astronomy Image Explorer. All Rights Reserved.