Image Details
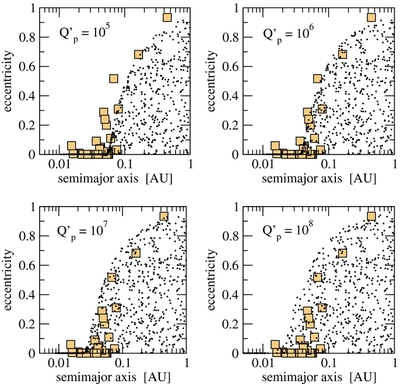
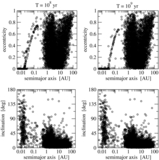
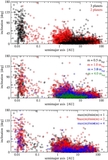
Caption: Figure 5.
Eccentricity–semimajor axis distribution expected from tidal models with four different values of Q′ p . Orange squares show the distribution of real exoplanets with measured λ (data from www.exoplanets.org).
Other Images in This Article


Show More
Copyright and Terms & Conditions
© 2012. The American Astronomical Society. All rights reserved.
Copyright ©
2025 Astronomy Image Explorer. All Rights Reserved.