Image Details
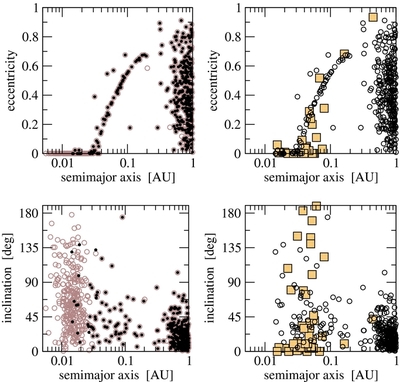
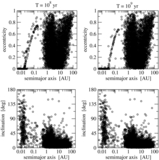
Caption: Figure 12.
Left: orbit distribution of hot Jupiters that we obtained starting from the three-planet systems. Gray open circles show the transient population of orbits at 10 8 yr, or the moment when the orbit of the hot Jupiter became circularized by tides (defined as e < 0.01). Black circles show orbits of planets that survived the tidal decay for T = 10 9 yr, regardless of their eccentricity. Right: comparison between the synthetic population (black circles) and known hot Jupiters with measured |λ| (orange squares).
Other Images in This Article


Show More
Copyright and Terms & Conditions
© 2012. The American Astronomical Society. All rights reserved.
Copyright ©
2025 Astronomy Image Explorer. All Rights Reserved.