Image Details
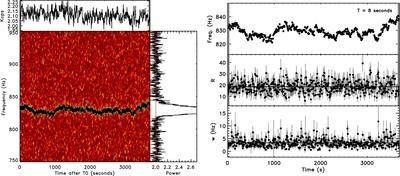
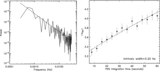
Caption: Figure 6.
Left: dynamical PDS of 4U1608-522 as recorded during the second segment of the 1996 March 3 observations. The time resolution is 4 s. The X-ray light curve is shown at the top (in kcps), and the average PDS over the whole segment is shown in the vertical right panel (cut to a maximum of 2.7). A strong QPO is visible with a mean frequency around 830 Hz. Right: the MLEs for this segment of data, as derived from fitting one single PDS with an integration time of 8 s (from the top to the bottom: the QPO frequency, R, and w).
Other Images in This Article


Copyright and Terms & Conditions
© 2012. The American Astronomical Society. All rights reserved.
Copyright ©
2025 Astronomy Image Explorer. All Rights Reserved.