Image Details
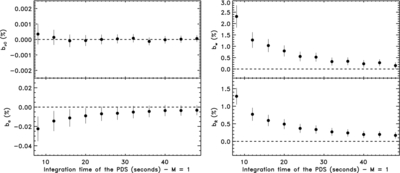
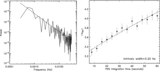
Caption: Figure 2.
Measured biases on the four model parameters (top left, ν 0; bottom left, a; top right, w; bottom right, R) as a function of the PDS integration time ( T). Those biases are derived from the difference between the sample mean of the MLE estimates from single PDS ( M = 1) and the best-fitted value of the average of the 16384 PDS generated for each integration time, and are expressed in percentage of the best-fitted averages. Error bars on the bias are derived from the standard error on the MLEs; they do not account for error on the fits to the averaged periodograms (which are generated from the same data and so are not independent of the averaged MLEs). As can be seen there is no bias in the MLEs of the QPO frequency and Poisson level, but there is a ≲ 2%–3%, hence negligible bias, in R and w at short PDS integration times (corresponding to a lower signal-to-noise ratio for the QPO). Note that 3% corresponds to a bias of ~0.1 Hz on w for the QPO considered here. As expected, these biases decrease when T increases.
Other Images in This Article


Copyright and Terms & Conditions
© 2012. The American Astronomical Society. All rights reserved.