Image Details
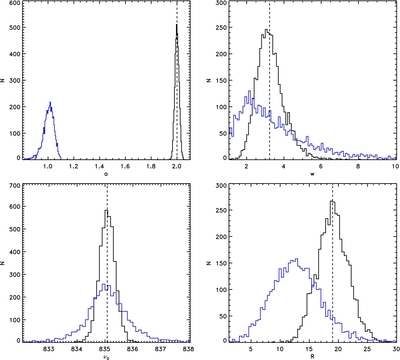
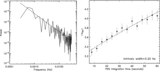
Caption: Figure 4.
Results of fitting simulated data with a constant and a Lorentzian QPO model. Each of the four panels shows the histogram of the estimates for one of the four model parameters (top left, a; bottom left, ν 0; top right, w; bottom right, R). The parameters were estimated using the MLE (black line) and the min(χ 2) method (blue line) by fitting the average of M = 4 periodograms (4096 samples). For min(χ 2) fitting, outliers in the parameter distribution (e.g., fitted R ⩾ 100) were removed before building the histograms (about 2% of the total sample are outliers). The vertical dashed line indicates the true parameter values for the simulations. Clearly, the MLEs show no strong biases, but the min(χ 2) results underestimate both the Poisson level and the QPO amplitude. The estimates have generally larger spreads from min(χ 2) fitting than from the MLE.
Other Images in This Article


Copyright and Terms & Conditions
© 2012. The American Astronomical Society. All rights reserved.