Image Details
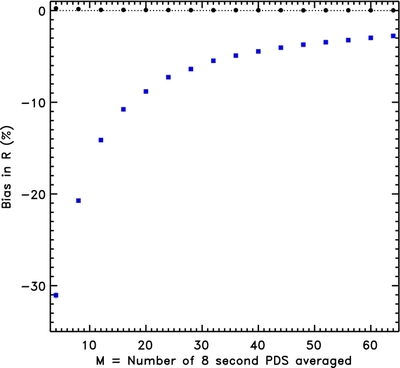
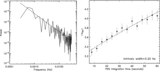
Caption: Figure 5.
Biases of fitted QPO amplitude ( R) with min(χ 2) (blue filled squares) and MLE (black filled circles) fitting for different M, from 4 to 64, in steps of 4. Error bars on the MLEs are plotted but are in many cases smaller than the plot symbols. 4096 averages of M PDS were fitted by the two methods. The bias of the MLEs of R is lower than 0.3% ( M = 4). At the opposite, biases of the R estimates from min(χ 2) fitting can be as large as ~30% for M = 4 and remain as large as ~2.5% for M = 64. This figure alone demonstrates that MLE should always be preferred, when averaging a very large number of PDS is not possible.
Other Images in This Article


Copyright and Terms & Conditions
© 2012. The American Astronomical Society. All rights reserved.