Image Details
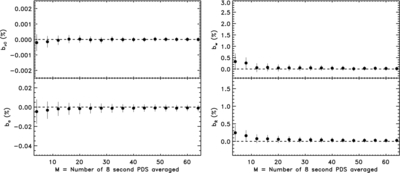
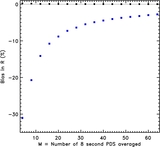
Caption: Figure 3.
Measured biases on the four model parameters (top left, ν 0; bottom left, a; top right, w; bottom right, R), as a function of the number of 8 s PDS averaged (same y-axis scale as Figure 2). Those biases are derived from the difference between the sample mean of 4096 MLEs (each one from fitting the average of M PDS), and an estimate of the average QPO parameters generated by the simulation over the entire set of 4096 × M PDS simulated. The biases are expressed in percentage of these average values. Error bars on the bias are derived from the standard error on the MLEs; they do not account for error on the fits to the averaged periodograms (which are generated from the same data and so are not independent of the averaged MLEs). Clearly, all the biases converge to zero.
Other Images in This Article

Copyright and Terms & Conditions
© 2012. The American Astronomical Society. All rights reserved.