Image Details
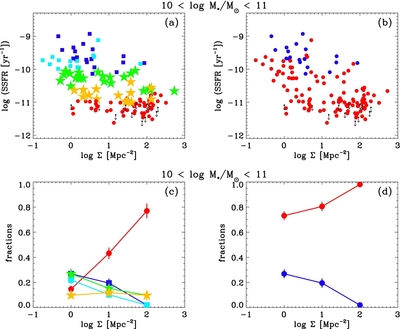
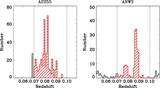
Caption: Figure 23.
Upper: SSFR as a function of galaxy local density at stellar mass bin log M */ M ☉ = [10, 11] for our N3-selected supercluster member galaxies in A2255 and in the ANWS. In the left panel, each galaxy type is the same as in Figure 21, while red and blue circles in the right panel indicate optical red and blue galaxies which are divided using the B − R vs. M N3 CMR (see Figure 13 for details). Lower: the fraction of each galaxy type as a function of local density. Undetected samples in S11 are counted as the weak-MXGs (left) and red (right) due to their low SSFRs.
Other Images in This Article
Show More
Copyright and Terms & Conditions
© 2012. The American Astronomical Society. All rights reserved.