Image Details
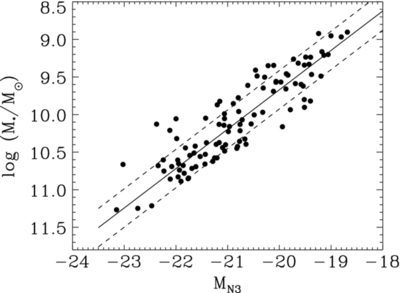
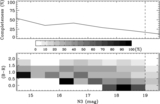
Caption: Figure 9.
Stellar masses computed with BC03 vs. the N3 absolute magnitude of galaxies in the ANWS. Here we used 102 galaxies for which five or more bands were used in the SED fits. The solid line indicates the best fit (log M */ M ☉ = –0.524 × M N3 – 0.810), and the two dashed lines represent the standard deviation of residuals to this fit (σ = 0.255).
Other Images in This Article
Show More
Copyright and Terms & Conditions
© 2012. The American Astronomical Society. All rights reserved.
Copyright ©
2025 Astronomy Image Explorer. All Rights Reserved.