Image Details
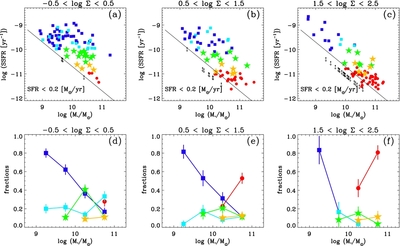
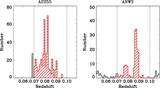
Caption: Figure 21.
Upper: SSFR as a function of stellar mass in three density bins for our N3-selected supercluster member galaxies in A2255 and in the ANWS. Local density is increasing from left to right. The red circle, yellow star, green star, cyan square, and blue square represent weak-MXG, intermediate-MXG, weak-SFG, dusty-SFG, and blue-SFG, respectively. Circles, stars, and squares also represent passively evolving, transition, and strong SF populations, respectively. The small circle with an arrow represents the object that is undetected in S11 (see Figure 13), and the solid lines in each panel show the detection limit of 0.2 M ☉ yr −1 for the ANWS sample. Lower: the fraction of each galaxy type as a function of stellar mass. Type fractions are defined as the ratio between the number of galaxies in each type class and the total number of galaxies at a fixed mass. The errors are calculated assuming that the fractions are the maximum values of the likelihood function (see the text for details). The total number of galaxies includes objects that are undetected in S11. Mass bins with less than three galaxies are excluded.
Other Images in This Article
Show More
Copyright and Terms & Conditions
© 2012. The American Astronomical Society. All rights reserved.