Image Details
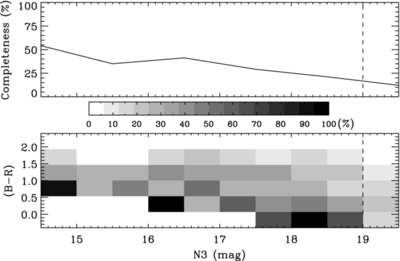
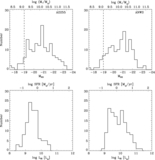
Caption: Figure 6.
Spectroscopic completeness as a function of the N3 apparent magnitude (top panel) and observed ( B − R) color and N3 apparent magnitude (bottom panel) of galaxies in the ANWS. Vertical dashed lines indicate the N3 magnitude cut used in this study.
Other Images in This Article
Show More
Copyright and Terms & Conditions
© 2012. The American Astronomical Society. All rights reserved.
Copyright ©
2025 Astronomy Image Explorer. All Rights Reserved.