Image Details
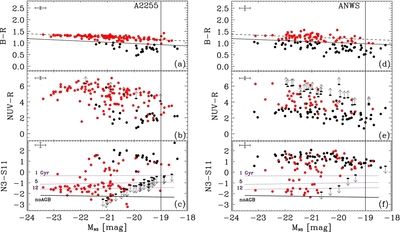
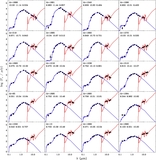
Caption: Figure 13.
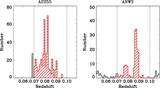
Top: the B − R vs. absolute N3 color–magnitude (CM) diagram for galaxies brighter than M N3 = −19 in A2255 (left) and in the ANWS (right). The CMR is shown by the dashed line and the horizontal solid line indicates the color cut adopted to classify red galaxies (redward of the solid line). The CMR in the ANWS is normalized to the red sequence of A2255. The color deviation from the CMR is defined as Δ( B − R) = 0.21(~ 3σ), where σ is the standard deviation of residuals to CMR fit. The cross in the upper left corner indicates the typical errors. Middle: the NUV − R vs. absolute N3 CM diagram for galaxies in A2255 (left) and in the ANWS (right). The GALEX Nearby Galaxy Survey NUV detection limits are shown for undetected galaxies (arrows). Bottom: the N3 − S11 vs. absolute N3 CM diagram for galaxies in A2255 (left) and in the ANWS (right). The dotted lines indicate the CMR calculated from the P03 AGB model SSPs, assuming a metallicity sequence at three different stellar ages (1, 5, and 12 Gyr, respectively). The horizontal solid line represents the P03 model SSPs without AGB dust. The AKARI S11 detection limits are given for undetected samples in S11 (arrows). The vertical line indicates the magnitude cut (N3 ≈ 19 corresponding to M N3 = −19 at the distance of the NEP supercluster).
Other Images in This Article
Show More
Copyright and Terms & Conditions
© 2012. The American Astronomical Society. All rights reserved.