Image Details
Caption: Figure 8.
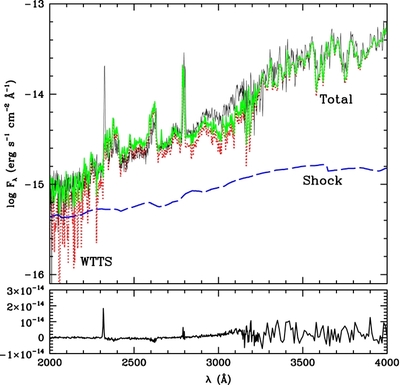
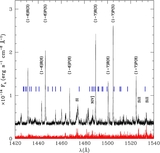
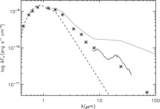
STIS spectrum of RECX-11 compared to predictions of the accretion shock model. Top panel: we show the STIS spectrum of RECX-11
(thin solid line) along with the template NUV and optical emission, the WTTS RECX-1 (red dotted line), and the emission predicted
from the accretion shock model (blue long dashed line), with
 . The thick solid green spectrum is the accretion shock model added to the WTTS spectrum. Bottom panel: the model (green)
was subtracted from the observations (black) and the residuals are shown.
. The thick solid green spectrum is the accretion shock model added to the WTTS spectrum. Bottom panel: the model (green)
was subtracted from the observations (black) and the residuals are shown.
Other Images in This Article
Copyright and Terms & Conditions
© 2011. The American Astronomical Society. All rights reserved.
Copyright ©
2026 Astronomy Image Explorer. All Rights Reserved.