Image Details
Caption: Figure 7.
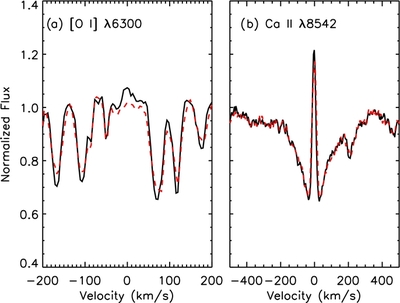
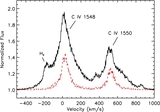
Accretion indicators. In each panel the black solid line shows the line profile of the CTTS, RECX-11, and the red dashed line
shows the WTTS, RECX-1. (a) [O i]. The [O i] λ6300 line probes wind emission in T Tauri stars. Weak [O i] emission appears
to be present in RECX-11 in excess over the WTTS but the detection is <3σ. If [O i] were present, it would be additional support
for accretion in RECX-11. (b) Ca ii. The Ca ii λ8542 shows an emission core on the photospheric absorption line. At low
 , this line is dominated by chromospheric emission and cannot be used to measure accretion rates, as shown by the identical
profiles of RECX-1 and RECX-11.
, this line is dominated by chromospheric emission and cannot be used to measure accretion rates, as shown by the identical
profiles of RECX-1 and RECX-11.
Other Images in This Article
Copyright and Terms & Conditions
© 2011. The American Astronomical Society. All rights reserved.