Image Details
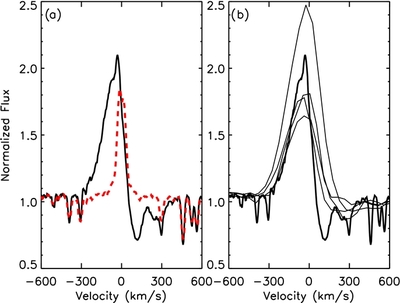
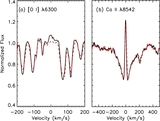
Caption: Figure 2.
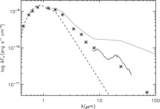
Hα line profiles. (a) MIKE spectra of RECX-11 (solid line) and RECX-1 (red dashed line). (b) SMARTS spectra of RECX-11 obtained within a few days of the HST observations. The MIKE spectrum is also shown for comparison as the thick solid line. The wide blue wing and redshifted absorption in the Hα profile of RECX-11, characteristic of accretion, are observed in the MIKE and SMARTS data. Transient narrow redshifted components are observed in the red wing of the lines and show the largest variability.
Other Images in This Article
Copyright and Terms & Conditions
© 2011. The American Astronomical Society. All rights reserved.
Copyright ©
2026 Astronomy Image Explorer. All Rights Reserved.