Image Details
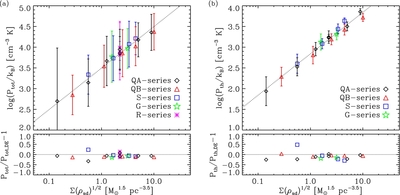
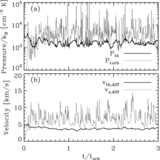
Caption: Figure 8.
Top: midplane (a) total and (b) thermal pressures of the diffuse gas as functions of
 . The points and error bars give the mean and standard deviations over
t/
t
orb = 2–3. The dotted lines in upper panels show fits
P
tot/
k
B = 9.9 × 10
3 cm
−3 K(Σ/10
M
☉ pc
−2)(ρ
sd/0.1
M
☉ pc
−3)
1/2 and
P
th/
k
B = 2.2 × 10
3 cm
−3 K(Σ/10
M
☉ pc
−2)(ρ
sd/0.1
M
☉ pc
−3)
1/2, respectively. Bottom: relative differences between measured midplane pressures and the dynamical equilibrium estimates using
Equation (35). The mean midplane pressure
P
tot varies only 13% relative to
P
tot, DE, showing that vertical dynamical equilibrium is an excellent approximation.
. The points and error bars give the mean and standard deviations over
t/
t
orb = 2–3. The dotted lines in upper panels show fits
P
tot/
k
B = 9.9 × 10
3 cm
−3 K(Σ/10
M
☉ pc
−2)(ρ
sd/0.1
M
☉ pc
−3)
1/2 and
P
th/
k
B = 2.2 × 10
3 cm
−3 K(Σ/10
M
☉ pc
−2)(ρ
sd/0.1
M
☉ pc
−3)
1/2, respectively. Bottom: relative differences between measured midplane pressures and the dynamical equilibrium estimates using
Equation (35). The mean midplane pressure
P
tot varies only 13% relative to
P
tot, DE, showing that vertical dynamical equilibrium is an excellent approximation.
Other Images in This Article


Show More
Copyright and Terms & Conditions
© 2011. The American Astronomical Society. All rights reserved.