Image Details
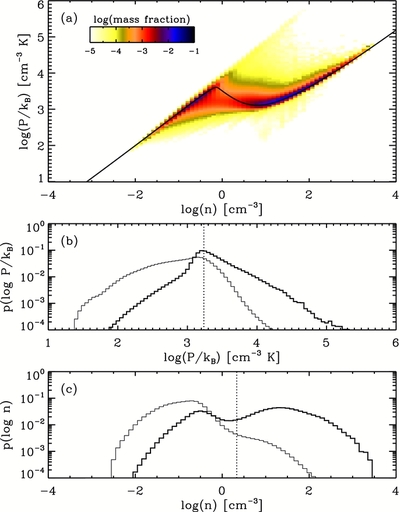
Caption: Figure 4.
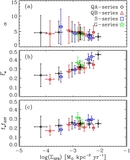
(a) Distribution of gas in the
n −
P/
k
B plane for Model QA10x2, averaged over
t/
t
orb = 2–3. The color bar gives the mass fraction in logarithmic scale. The solid curve marks the locus of thermal equilibrium
at the mean heating rate of
![]() Γ
Γ
![]() = 0.76Γ
0. Mass-weighted (thick) and volume-weighted (thin) probability distribution functions are shown for (b) thermal pressure and
(c) number density. The vertical dotted lines in (b) and (c) mark the mean midplane thermal pressure and number density, respectively,
of the diffuse gas. These results show that the system evolves to a state in which approximate two-phase thermal equilibrium
at a common pressure holds for the atomic gas.
= 0.76Γ
0. Mass-weighted (thick) and volume-weighted (thin) probability distribution functions are shown for (b) thermal pressure and
(c) number density. The vertical dotted lines in (b) and (c) mark the mean midplane thermal pressure and number density, respectively,
of the diffuse gas. These results show that the system evolves to a state in which approximate two-phase thermal equilibrium
at a common pressure holds for the atomic gas.
Other Images in This Article


Show More
Copyright and Terms & Conditions
© 2011. The American Astronomical Society. All rights reserved.