Image Details
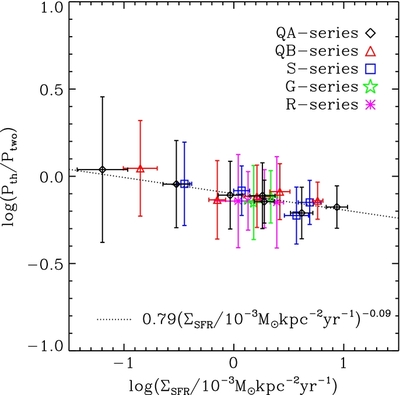
Caption: Figure 10.
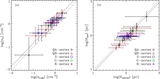
Measured midplane thermal pressure P th of the diffuse gas relative to the two-phase thermal equilibrium pressure P two, as a function of Σ SFR. The points and error bars give the mean and standard deviations over t/ t orb = 2–3 for each model. The dotted line, with a slope of −0.09, gives the best fit. Heating/cooling and mass exchange between warm and cold atomic phases enables the mean pressure to track the (radiation) energy input from star formation P th∝ P two∝Σ SFR over more than two orders of magnitude in Σ SFR.
Other Images in This Article


Show More
Copyright and Terms & Conditions
© 2011. The American Astronomical Society. All rights reserved.
Copyright ©
2025 Astronomy Image Explorer. All Rights Reserved.