Image Details
Caption: Figure 5.
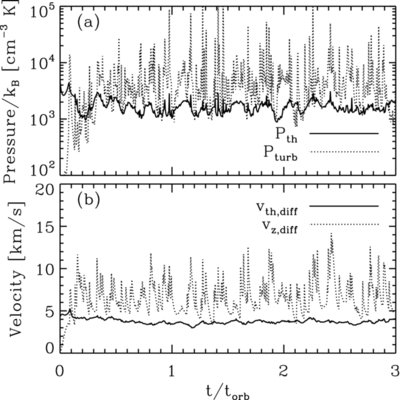
Time evolution of the midplane thermal and turbulent pressures (a) and the thermal and turbulent velocity dispersions (b)
of the diffuse component for model QA10x2. In (a),
P
th initially decreases as the gas cools, while
P
turb increases rapidly after the gas falls toward midplane and is stirred up by SN explosions. After a few cloud formation and
feedback cycles (a few 10 s of Myr),
P
th and
P
turb reach saturation values of
![]() P
th/
k
B
P
th/
k
B
![]() ~ 1680 cm
−3 K and
~ 1680 cm
−3 K and
![]() P
turb/
k
B
P
turb/
k
B
![]() ~ 5440 cm
−3 K, respectively, with a relative fluctuation amplitudes of 0.21 and 0.52. In (b), the velocity dispersions saturate at
~ 5440 cm
−3 K, respectively, with a relative fluctuation amplitudes of 0.21 and 0.52. In (b), the velocity dispersions saturate at
![]() v
th, diff
v
th, diff
![]() = 3.7 km s
−1 and
= 3.7 km s
−1 and
![]() v
z, diff
v
z, diff
![]() = 6.8 km s
−1, respectively, with relative fluctuation amplitudes of 5% and 30%.
= 6.8 km s
−1, respectively, with relative fluctuation amplitudes of 5% and 30%.
Other Images in This Article


Show More
Copyright and Terms & Conditions
© 2011. The American Astronomical Society. All rights reserved.