Image Details
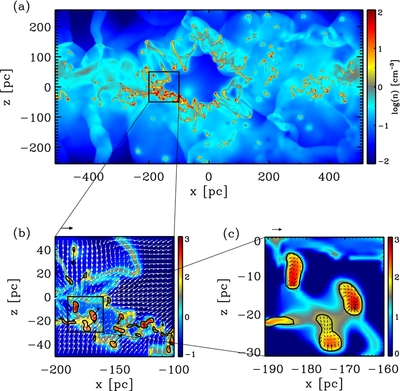
Caption: Figure 3.
(a) Density structure in the whole simulation domain of Model QA10x2 at t/ t orb = 2.22, including a large, fragmented, expanding shell produced by a recent SN event. (b) The rectangular section in (a) is enlarged to identify dense clouds ( n > 50 cm −3), outlined by black contours, that formed in a region of converging flow where the shell collides with surrounding gas. The white arrows represent the background velocity field, while the black arrows show the mean velocity of each dense cloud. (c) The section marked in (b) is further enlarged to show internal velocity structure of three selected dense clouds. The color bars (whose range differs from panel to panel) indicate number density in logarithmic scale. The sizes of the arrows outside the boxes in (b) and (c) correspond to 10 km s −1 and 5 km s −1, respectively.
Other Images in This Article

Show More
Copyright and Terms & Conditions
© 2011. The American Astronomical Society. All rights reserved.