Image Details
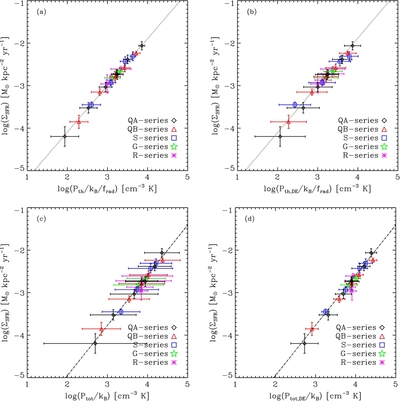
Caption: Figure 15.
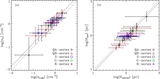
Surface density of star formation Σ SFR measured from the simulations as functions of (a) the measured midplane thermal pressure of the diffuse gas P th, (b) the predicted midplane thermal pressure P th, DE, (c) the measured midplane total pressure of the diffuse gas P tot, and (d) the predicted midplane total pressure P tot, DE. The points and error bars give the mean and standard deviations over t/ t orb = 2–3. Predicted pressures use the dynamical equilibrium Equation (35) and measured values of f diff, α, and σ z, diff for each model. In (a) and (b) P th and P th, DE are divided by f rad to compensate for varying heating efficiency so that Series R may be compared with other series. In top and bottom panels, dotted lines are obtained from Equations (11) and (45), respectively, using the numerical calibrations (42) and (44). The dashed lines in bottom panels show the best fit given by Equation (49). The pressures and Σ SFR are extremely well correlated, consistent with the idea that Σ SFR adjusts until the pressures (driven by feedback) match equilibrium requirements.
Other Images in This Article


Show More
Copyright and Terms & Conditions
© 2011. The American Astronomical Society. All rights reserved.