Image Details
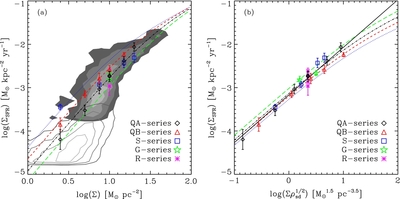
Caption: Figure 13.
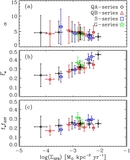
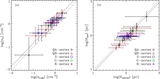
SFR surface density Σ SFR as a function of (a) Σ and (b) Σρ 1/2 sd for all models. The points and error bars give the mean and standard deviations over t/ t orb = 2–3, respectively. In both panels, blue dotted, red dashed, black dot-dashed, and green long-dashed lines give the theoretical predictions obtained by solving Equations (5), (11), and (35) simultaneously for s 0 = 0.02, 0.07, 0.28, and 1.10, respectively. The parameters σ z = 7 km s −1, α = 5, and t SF, GBC = 1.3 Gyr are held fixed for these analytic comparisons, while η th varies following the numerical fit in Equation (42) with f rad = 1. Filled and empty contours in (a) show the observational measurements in the regions inside (Bigiel et al. 2008) and outside (Bigiel et al. 2010) of the optical radius, respectively, for nearby spirals and dwarf galaxies: the contour levels from dark to light correspond to 10%, 25%, 50%, and 75% of the data. With higher s 0 and/or f rad at low-Σ (not shown), the models can match the observations beyond the optical radius. The black solid line in (b) denotes the power-law solution for Σ SFR in Equation (47). Note that Σ SFR is much better correlated with the combination Σρ 1/2 sd than with Σ alone.
Other Images in This Article


Show More
Copyright and Terms & Conditions
© 2011. The American Astronomical Society. All rights reserved.