Image Details
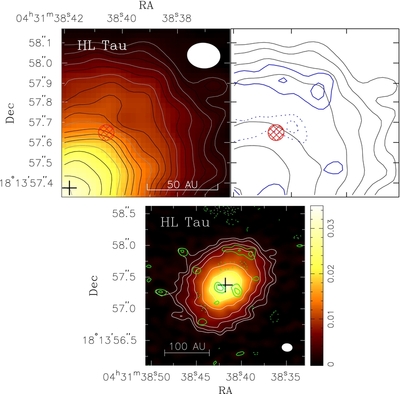
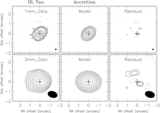
Caption: Figure 8.
HL Tau in the λ = 1.3 mm continuum overlaid with residual contours in the bottom. The disk image is the same as Figure 1 and the levels of residual contours are two and three times σ = ±0.8 mJy beam −1. The top row shows the northwest quadrant region zoomed-in. The contour levels of the left are 2.5, 3.0, 4.0, 5.0, 6.3, 8.0, 10.0, 11.5, 13.0, 14.5, 16.0, 18.0, 20.0, 22.0, 25.0, 28.0, 32.0, 36.0, and 40.0 times σ = ±0.8 mJy beam −1. The red hashed circles indicate where a protoplanet has been claimed. As shown, no excess signal has been detected.
Other Images in This Article
Copyright and Terms & Conditions
© 2011. The American Astronomical Society. All rights reserved.
Copyright ©
2025 Astronomy Image Explorer. All Rights Reserved.