Image Details
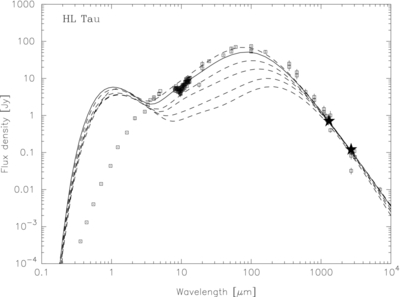
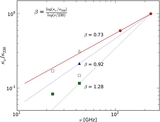
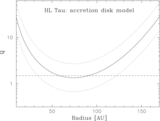
Caption: Figure 3.
HL Tau SED overlaid with models of various b height values. The solid line is the case of b height = 1.5 and the dashed lines are cases of b height = 0.1, 0.2, 0.5, 1.0, and 2.0 from the bottom. The two stars indicate our data points 700 and 120 mJy at λ = 1.3 and 2.7 mm, respectively.
Other Images in This Article
Copyright and Terms & Conditions
© 2011. The American Astronomical Society. All rights reserved.
Copyright ©
2025 Astronomy Image Explorer. All Rights Reserved.