Image Details
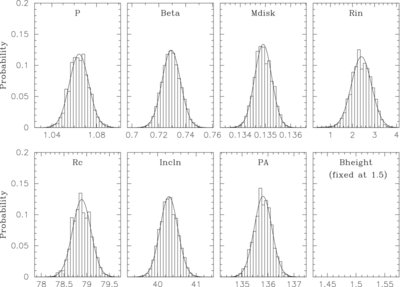
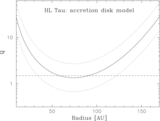
Caption: Figure 6.
Posterior distributions of parameters in HL Tau. The solid lines of the plots indicate normal distributions of the posterior-weighted means and standard deviations of the parameter distributions. The posterior-weighted means and standard deviations are listed in Table 1 with the parameter search ranges.
Other Images in This Article
Copyright and Terms & Conditions
© 2011. The American Astronomical Society. All rights reserved.
Copyright ©
2025 Astronomy Image Explorer. All Rights Reserved.