Image Details
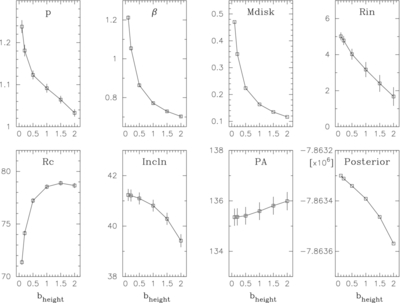
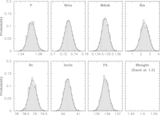
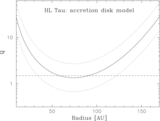
Caption: Figure 2.
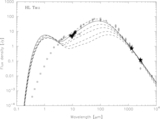
Free parameter variation along changing b height. The thinner models are preferred by both of our millimeter wavelength images, based on the posterior values. However, thin disk models cannot explain the mid-infrared fluxes (Figure 3).
Other Images in This Article
Copyright and Terms & Conditions
© 2011. The American Astronomical Society. All rights reserved.
Copyright ©
2025 Astronomy Image Explorer. All Rights Reserved.