Image Details
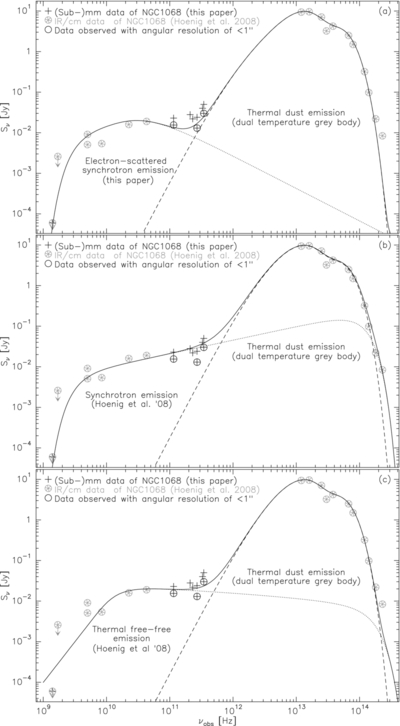
Caption: Figure 15.
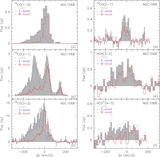
SED of the continuum emission in NGC 1068, based on data from this work, (Krips et al. 2006; black crosses) and (Hönig et al. 2008; gray crosses). The dotted line represents the model for the radio continuum emission (either electron-scattered synchrotron emission (a), synchrotron emission (b), or free–free absorption (c)), the dashed line represents the model for the IR data (a two-temperature gray body, (a)–(c)), and the solid line represents the composite of both, (a)–(c)). The data observed at an angular resolution below 1'' are additionally marked with a circle.
Other Images in This Article
Show More
Copyright and Terms & Conditions
© 2011. The American Astronomical Society. All rights reserved.
Copyright ©
2025 Astronomy Image Explorer. All Rights Reserved.