Image Details
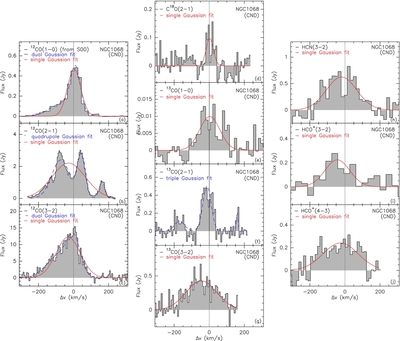
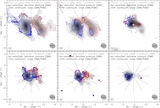
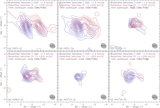
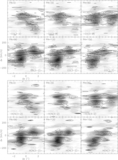
Caption: Figure 3.
Spatially integrated spectrum of different molecular lines in NGC 1068. The single-line Gaussian fit is indicated with a red dotted line (parameters are listed in Table 5) while the multiple Gaussian fit is plotted with a blue dashed line.
Other Images in This Article
Show More
Copyright and Terms & Conditions
© 2011. The American Astronomical Society. All rights reserved.
Copyright ©
2025 Astronomy Image Explorer. All Rights Reserved.