Image Details
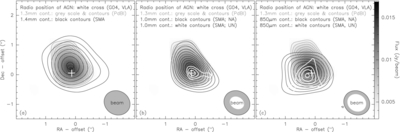
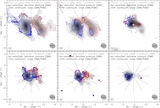
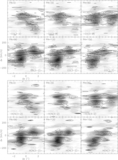
Caption: Figure 1.
Continuum emission of NGC 1068 at λ = 1.4 mm ((a); black contours), 1.3 mm ((a)–(c); gray scale and gray contours), 1.0 mm ((b); black contours), and 850 μm ((c); black contours), observed with SMA and IRAM PdBI. The white crosses denote the position of the AGN measured by Gallimore et al. (2004, G04). The contours of the 1.3 mm continuum emission (PdBI) start at 5σ = 4 mJy in steps of 1σ. (a) The contours of the 1.4 mm continuum emission (SMA) start at 5σ = 4 mJy in steps of 1σ. (b) The contours of the 1.0 mm continuum emission (SMA, NA) start at 3σ = 1.6 mJy in steps of 1σ, while the contours of the uniformly mapped 1.0 mm continuum emission run from 3σ = 2.3 mJy in steps of 1σ. (c) The contours of the 850 μm continuum emission (SMA, NA) start at 3σ = 2.4 mJy in steps of 1σ, while the contours of the uniformly mapped 850 μm continuum emission run from 3σ = 2.6 mJy in steps of 1σ.
Other Images in This Article
Show More
Copyright and Terms & Conditions
© 2011. The American Astronomical Society. All rights reserved.