Image Details
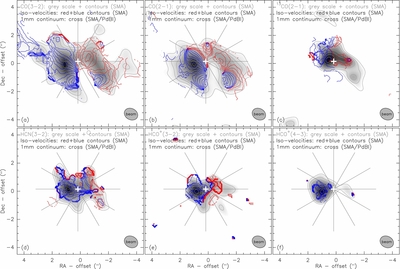
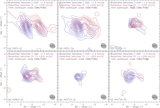
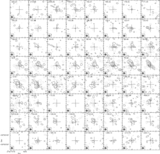
Caption: Figure 5.
Iso-velocity maps of the different molecular lines observed in NGC 1068. The gray scale corresponds to the velocity-integrated emission of each line with the same contours as used in Figure 2. The velocity contours are in steps of 10 km s −1 around the systemic velocity of NGC 1068. The gray lines indicate the cuts along which the position–velocity diagrams (see Figure 10) were taken for the respective molecules ( 12CO( J = 2–1), 12CO( J = 2–1), and HCN( J = 3–2)).
Other Images in This Article
Show More
Copyright and Terms & Conditions
© 2011. The American Astronomical Society. All rights reserved.
Copyright ©
2025 Astronomy Image Explorer. All Rights Reserved.