Image Details
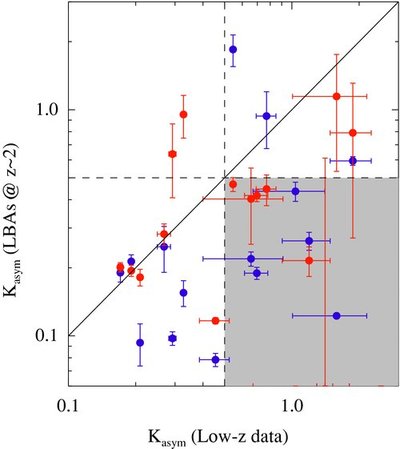
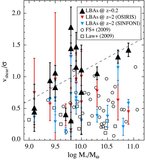
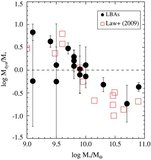
Caption: Figure 8.
Kinemetry measurements for our high-redshift simulations as a function of "intrinsic" values measured at low redshift. Dashed lines show the same threshold of K asym = 0.5. Red points represent OSIRIS-AO simulations, while blue points represent the SINFONI non-AO simulations. The gray shaded area indicates the region of the plot where one finds LBAs having high-asymmetry values at low redshift but low values at z ~ 2.2 (lower right quadrant). In the classification scheme of Shapiro et al. (2008), these objects would likely be classified as rotationally supported "disks."’
Other Images in This Article

Show More
Copyright and Terms & Conditions
© 2010. The American Astronomical Society. All rights reserved.
Copyright ©
2025 Astronomy Image Explorer. All Rights Reserved.