Image Details
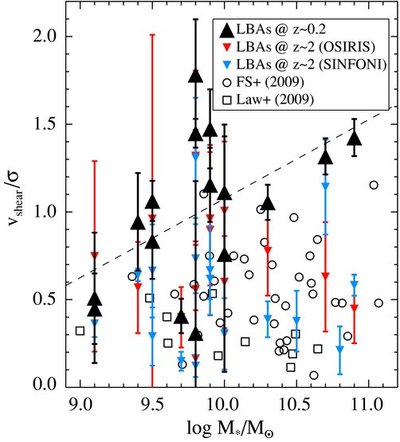
Caption: Figure 5.
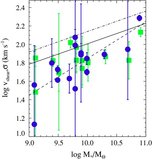
Ratios between velocity shear and velocity dispersion v shear/σ as a function of stellar mass (black triangles). The dashed line shows a fit to the v shear/σ data at their intrinsic redshift. We see a moderate trend, indicating more massive galaxies have a stronger rotational dynamical component than less massive ones. Also shown as downward triangles are v shear/σ values for galaxies artificially redshifted to z ~ 2 (see the text in Section 2.5). In this case, red triangles represent the OSIRIS simulated data, and blue triangles represent SINFONI non-AO simulations. Values from actual high-redshift observations are presented as hollow symbols, representing data from Förster Schreiber et al. (2009, open circles) and Law et al. (2009, open squares). The LBAs form an upper envelope with respect to the observational data at high redshift, but span a very similar range of parameter space when simulated at z = 2.
Other Images in This Article


Show More
Copyright and Terms & Conditions
© 2010. The American Astronomical Society. All rights reserved.