Image Details
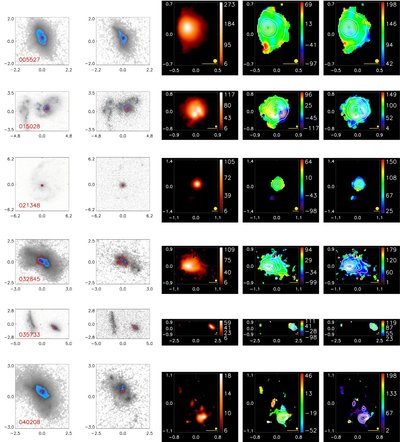
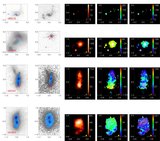
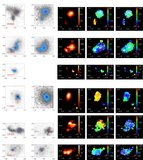
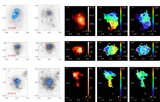
Caption: Figure 1.
We show here the velocity moment maps for all galaxies observed for this work. The two leftmost figures show the HST rest-frame optical (left) and UV (right) morphologies, with logarithmic (black) and linear (blue) stretches. The Paα S/N levels are overlaid in red. There is no UV image available for 101211. The following images show, from left to right, the S/Ns, line-of-sight velocity in km s −1, and line-of-sight velocity dispersion, also in km s −1. For the latter two, we overplot S/N contours in white. The axes show the angular scale in arcsec; orientation is the same in every panel, with north pointing up and east to the left. We indicate in each panel the FWHM of a point source as a proxy for spatial resolution and the physical scale corresponding to 1 kpc at the redshift of each galaxy.
Other Images in This Article


Show More
Copyright and Terms & Conditions
© 2010. The American Astronomical Society. All rights reserved.