Image Details
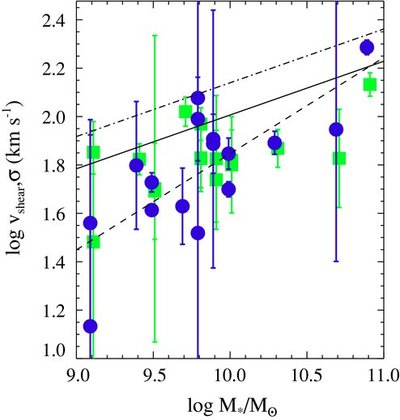
Caption: Figure 4.
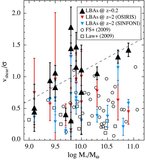
Velocity shear v shear (blue circles) and velocity dispersion σ (green squares) as a function of stellar mass. The plot shows clearly how more massive galaxies show a stronger velocity shear than less massive ones, particularly the ones above ~10 10 M ☉. The same trend, albeit weaker, exists for velocity dispersion σ. Dashed line shows a power-law fit to our data, while the solid line is the Tully–Fisher relation at z ~ 0 according to Bell & de Jong (2001). The dot-dashed line shows the Tully–Fisher relation at z ~ 2 according to Cresci et al. (2009).
Other Images in This Article


Show More
Copyright and Terms & Conditions
© 2010. The American Astronomical Society. All rights reserved.
Copyright ©
2025 Astronomy Image Explorer. All Rights Reserved.