Image Details
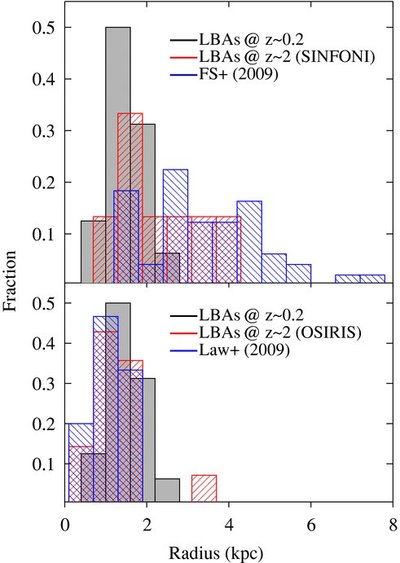
Caption: Figure 3.
Distribution of sizes for LBAs. Black filled histograms represent intrinsic values, while red hashed histograms represent simulated values at high redshift as would be detected with SINFONI (top) and OSIRIS (bottom). Blue histograms indicate size distributions of actual high-redshift starburst galaxies as measured with corresponding instruments by Förster Schreiber et al. (2009) and Law et al. (2009).
Other Images in This Article


Show More
Copyright and Terms & Conditions
© 2010. The American Astronomical Society. All rights reserved.
Copyright ©
2025 Astronomy Image Explorer. All Rights Reserved.