Image Details
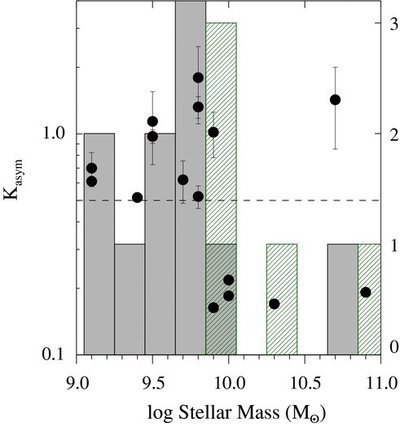
Caption: Figure 7.
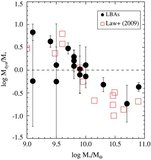
Kinemetric asymmetry measurements as a function of galactic stellar mass. The left y-axis shows values of K asym, while the right y-axis shows quantities for histograms. Gray histogram shows the number of galaxies that would be classified as mergers in Shapiro et al. (2008), while the green hatched histogram shows the number of galaxies that would be classified as disks. Galaxies with high K asym are predominantly less massive, but the lowest value of stellar mass for a galaxy with K asym < 0.5 is 9.9.
Other Images in This Article

Show More
Copyright and Terms & Conditions
© 2010. The American Astronomical Society. All rights reserved.
Copyright ©
2025 Astronomy Image Explorer. All Rights Reserved.