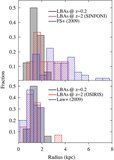
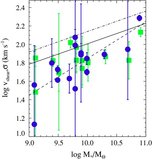
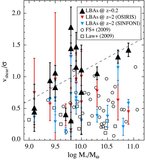
Image Details
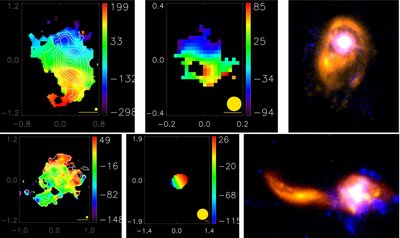
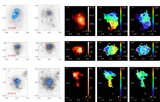
Caption: Figure 10.
Velocity maps at low (left) and high (center) redshifts for 210358 and 135355. On the right, we show the optical morphologies of each object as seen by HST, combining optical (orange) and ultraviolet (blue) data. High- z simulated map for 210358 is for OSIRIS data, while for 135355 this is the simulated SINFONI data. In the top case, we see a galaxy for which a disk is apparent even at low redshift, while in the second case we notice the effect of loss of spatial resolution. Both these galaxies are classified as mergers through quantitative morphological analysis of the optical images.
Other Images in This Article

Show More
Copyright and Terms & Conditions
© 2010. The American Astronomical Society. All rights reserved.