Image Details
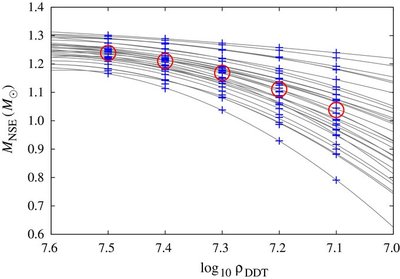
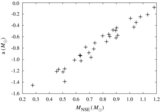
Caption: Figure 7.
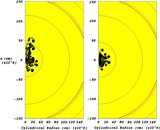
Quadratic fits (gray lines) to the NSE yields for each realization (blue crosses) and the average NSE yield at each transition
density (red circles). The qualitative similarity between this figure and the right panel of Figure
6 is due to the near 1:1 correlation between
M
NSE and
 .
.
Other Images in This Article

Show More
Copyright and Terms & Conditions
© 2010. The American Astronomical Society. All rights reserved.
Copyright ©
2025 Astronomy Image Explorer. All Rights Reserved.