Image Details
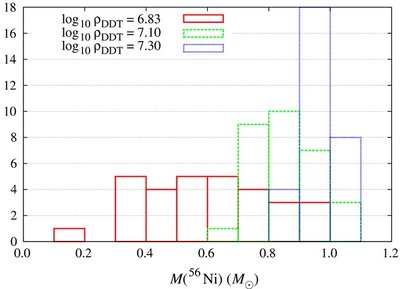
Caption: Figure 3.
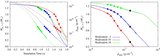
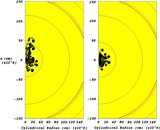
Distributions of the
56Ni yield for three different transition densities ρ
7 = 0.76 (solid), 1.26 (dashed), and 2.00 (dotted). Note that the variance increases with decreasing transition density. The
distribution corresponding to ρ
7 = 0.76 is calculated by extrapolating the dependence of DDT density as described in Section 5.1 such that the mean
M(
56Ni)
![]() 0.60
M
☉ is consistent with observations.
0.60
M
☉ is consistent with observations.
Other Images in This Article

Show More
Copyright and Terms & Conditions
© 2010. The American Astronomical Society. All rights reserved.
Copyright ©
2025 Astronomy Image Explorer. All Rights Reserved.