Image Details
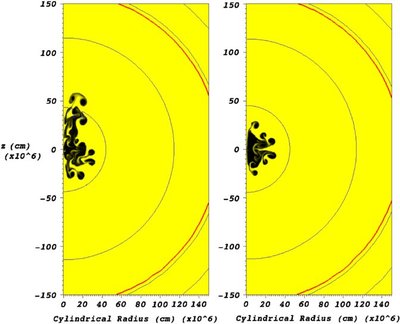
Caption: Figure 10.
Snapshots of realization 18 (left) and realization 10 (right) at a simulation time of 0.4 s. Realization 18 produced the highest yield and shows the development of a single dominant plume while realization 10 had the lowest yield and shows all plumes developing at about the same rate. Shown in color are fuel and burning products: unburned C, O, Ne (yellow) and Fe-group (NSE, black). Density in g cm −3 is indicated by contours (blue) logarithmically spaced at integer powers of 10 as well as the DDT density of 1.26 × 10 7 g cm −3 (red).
Other Images in This Article

Show More
Copyright and Terms & Conditions
© 2010. The American Astronomical Society. All rights reserved.
Copyright ©
2025 Astronomy Image Explorer. All Rights Reserved.