Image Details
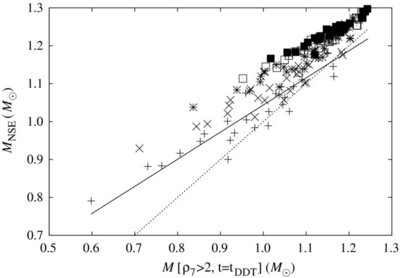
Caption: Figure 5.
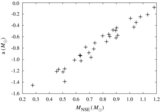
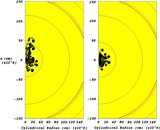
Mass burned to NSE as compared to the mass above a density of 2 × 10
7 g cm
−3 at the first DDT time for each realization in our sample. The different shapes plotted (+, ×, *,
 , █) correspond to different transition densities (10
7.1, 10
7.2, 10
7.3, 10
7.4, 10
7.5), respectively. The solid line shows the linear fit to yields produced with a DDT density of 10
7.1 g cm
−3 most closely matching the DDT density used in Townsley et al. (2009). The dashed line shows a 1:1 correlation between the
NSE yield and mass above 2 × 10
7 g cm
−3. The lowest two DDT densities are less than the density threshold 2 × 10
7 g cm
−3 and thus show more scatter about the linear relation due to increased dependence on the plume morphology.
, █) correspond to different transition densities (10
7.1, 10
7.2, 10
7.3, 10
7.4, 10
7.5), respectively. The solid line shows the linear fit to yields produced with a DDT density of 10
7.1 g cm
−3 most closely matching the DDT density used in Townsley et al. (2009). The dashed line shows a 1:1 correlation between the
NSE yield and mass above 2 × 10
7 g cm
−3. The lowest two DDT densities are less than the density threshold 2 × 10
7 g cm
−3 and thus show more scatter about the linear relation due to increased dependence on the plume morphology.
Other Images in This Article

Show More
Copyright and Terms & Conditions
© 2010. The American Astronomical Society. All rights reserved.