Image Details
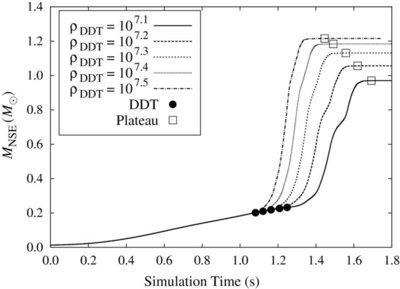
Caption: Figure 4.
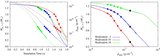
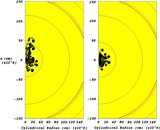
NSE yields for realization 2 at each transition density used in this study. The closed circles indicate the time the flame first reaches the DDT density. The open squares show the time the NSE yield has plateaued as defined by Equation (4).
Other Images in This Article

Show More
Copyright and Terms & Conditions
© 2010. The American Astronomical Society. All rights reserved.
Copyright ©
2025 Astronomy Image Explorer. All Rights Reserved.