Image Details
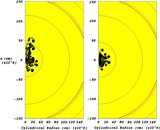
Caption: Figure 6.
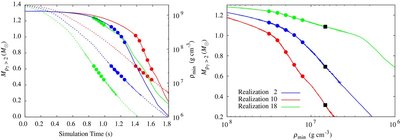
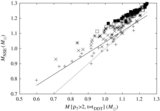
Comparison of the evolution of the white dwarf defined by the mass above the density threshold (
 ) to the plume evolution defined by the minimum flame density (ρ
min). The left panel presents the evolution of
) to the plume evolution defined by the minimum flame density (ρ
min). The left panel presents the evolution of
 (solid) and ρ
min (dotted) as a function of simulation time for realizations 2 (blue), 10 (red), and 18 (green) showing the expansion rate
of the WD and the plume rise time with DDT times (circles) associated with each DDT density emphasized.
(solid) and ρ
min (dotted) as a function of simulation time for realizations 2 (blue), 10 (red), and 18 (green) showing the expansion rate
of the WD and the plume rise time with DDT times (circles) associated with each DDT density emphasized.
 is defined as the total mass with density greater than 2 × 10
7 g cm
−3 and ρ
min is defined as the minimum density at which the flame is burning material. The translation into
is defined as the total mass with density greater than 2 × 10
7 g cm
−3 and ρ
min is defined as the minimum density at which the flame is burning material. The translation into
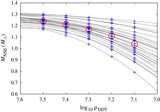
 as a function of ρ
min is shown in the right panel for comparison to
M
NSE as a function of ρ
DDT shown in Figure
7. We also highlight the fiducial DDT density as black squares. These plots emphasize the importance of the rate of expansion
of the WD and the plume rise time as a function of density in determining the relation between the NSE yield and DDT density.
Realization 2 produces NSE yields that are close to the average while realizations 10 and 18 produce the lowest and highest
yields, respectively.
as a function of ρ
min is shown in the right panel for comparison to
M
NSE as a function of ρ
DDT shown in Figure
7. We also highlight the fiducial DDT density as black squares. These plots emphasize the importance of the rate of expansion
of the WD and the plume rise time as a function of density in determining the relation between the NSE yield and DDT density.
Realization 2 produces NSE yields that are close to the average while realizations 10 and 18 produce the lowest and highest
yields, respectively.
Other Images in This Article

Show More
Copyright and Terms & Conditions
© 2010. The American Astronomical Society. All rights reserved.