Image Details
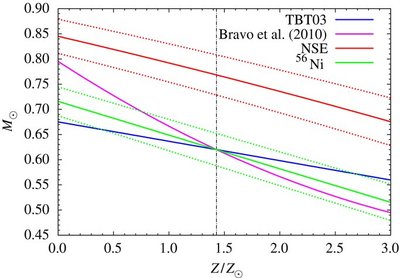
Caption: Figure 13.
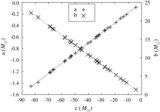
Solution of M NSE (red) and M 56 (green) computed as a function of metallicity as compared to the 56Ni relations from Timmes et al. (2003; blue) and Bravo et al. (2010; magenta) normalized to the average 56Ni yield from our simulations. The dashed lines show the propagated standard deviation of the mean. The vertical dot-dashed line indicates the parameter space in which this study was performed. These results were evaluated with a fiducial transition density of 6.76 × 10 6 g cm −3 at Z = 1.4 Z ☉.
Other Images in This Article

Show More
Copyright and Terms & Conditions
© 2010. The American Astronomical Society. All rights reserved.
Copyright ©
2025 Astronomy Image Explorer. All Rights Reserved.