Image Details
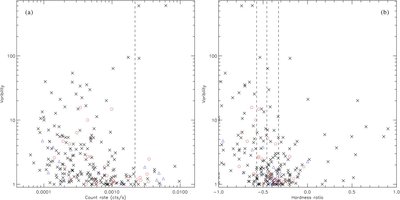
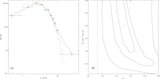
Caption: Figure 9.
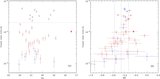
Source variability (see the text for definition) vs. (a) count rate and (b) hardness ratio. Field sources detected within R = 4′ are shown by crosses, while LMXBs detected in blue and red GCs are shown by blue triangles and red circles, respectively. The dashed line in panel (a) represents the Eddington luminosity of an accreting NS with a mass of 1.4 M ☉. The dashed lines in panel (b), from left to right, correspond to hardness ratios of an absorbed power-law spectrum with a fixed N H = 10 21 cm −2 and a photon index of 2.0, 1.7, and 1.4, respectively.
Other Images in This Article

Copyright and Terms & Conditions
© 2010. The American Astronomical Society. All rights reserved.
Copyright ©
2025 Astronomy Image Explorer. All Rights Reserved.